Cannabis Infographics
Here's some cannabis infographics we hope you'll find helpful. Feel free to capture and share them for personal use.
We think these infographics cover some of the more important concepts patients and consumers need to understand about cannabis and hemp products. We firmly believe more knowledge means more control, and better outcomes.
If you like stuff to put in your pocket or purse, we've got a small printed pocket guide. We send a few to anyone who takes our anonymous "What Works Best" survey - FREE. It only takes about 3 minutes and we always publish the results on this site for free to everyone.
The Other 75%
The Other 75% refers to the approximately 75% of the weight of cannabis flower that is not measured or tracked. Even including Flavonoids and Volatile Sulfur Compounds (VSCs), the MAJORITY of molecules in cannabis flower are not quantified. Since many people report that flower is more effective (for them) than extracts, it seems logical that we start identifying and quantifying some of "The Other 75%". We know esters and aldehydes are there, but no one tests for them, or anything besides Terpenes. Occasionally Flavonoids and VSCs are tested, but there weight is rarely above 0.01% each. 75% is simply too much to ignore, especially for medicinal use.

Blood Plasma Concentration Curve
This is how doctors and researchers look at a medicine's ability to get into (and stay in) the human bloodstream, often called bioavailability. They consider how long the blood plasma concentration of the medicine's key molecules remain above a minimum level. Since duration of effect is an important factor in a medicine, they look at the Area Under the Curve (AUC) of the time plot of blood plasma concentration.

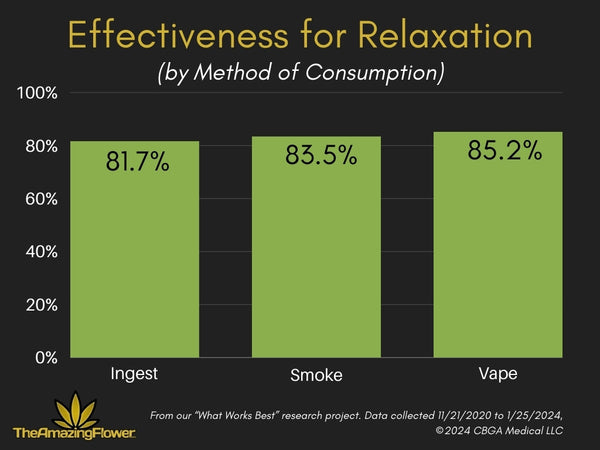
Adults looking for relaxation say vaping is most effective
More results from our ongoing survey asking, "What Works Best for YOU"?
People tell us that "Relaxation" is the single most common goal (63.2%) for adult use cannabis. Among the main methods of consumption, vaporizing is rated as most effective for this goal (85.2% effective), but smoking and ingesting are both rated over 80% effective.
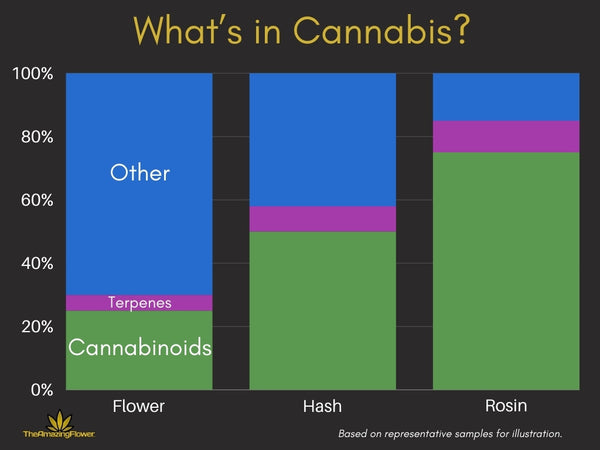
"What's in Cannabis" Chart
The following chart gives a quick visual representation of what we know from lab results on cannabis flower, hashish, and rosin - all products that do not use any solvents. The "other" parts are made up of thiols, esters, aldehydes, sterols, ketones, volatile sulphur compounds, and many other components that labs do not test for. Hashish and Rosin effectively extract the "other" stuff. Whether that's good is up to you. Some people say that hashish and rosin don't work as well for them. Maybe that "other" silent majority is more important than we realize.
ads:
Cannabis Flower Terpene Batch Comparison
Here's a "top 5" terpene spectrum comparison for 4 consecutive batches from the same grower in Florida. It's a fairly famous cultivar called Super Lemon Haze and is dominant in Terpinolene and Caryophyllene. The proportions are mostly consistent. The total terpene content (of these top 5 terpenes) varies from just over 2% to about 3%. We think this simple chart makes understanding terpene profiles a little easier.

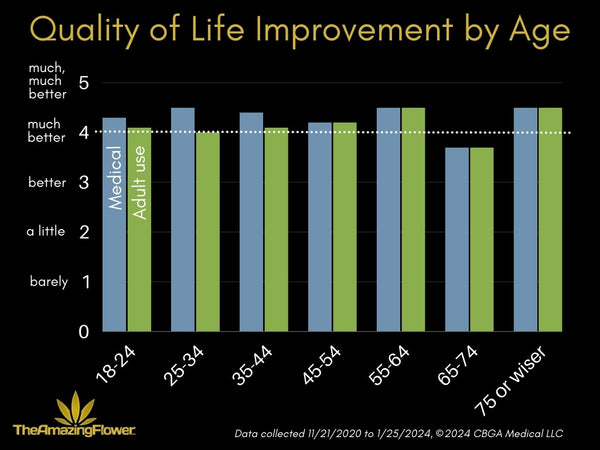
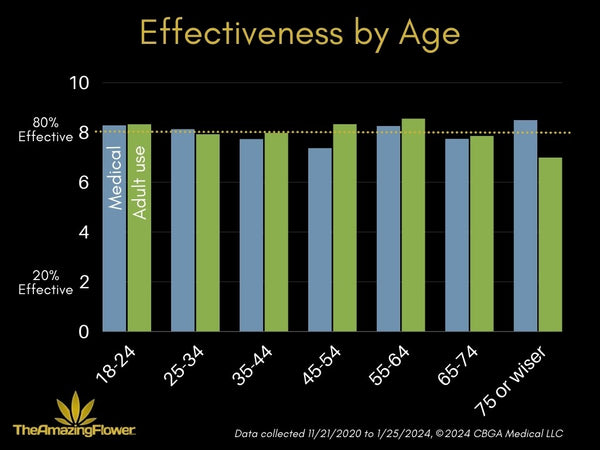
Here's a few summary charts from our "What Works Best" cannabinoid product effectiveness research. These and many more are on our Survey Results page.

These are the labels we use for our own purchases that help us "see" the terpene profile by using a stacked bar chart, or terpene spectrum.
This one is a blend of two flower types that balance Terpinolene and Linalool at 0.4% each. The Linalool comes from a cultivar called "Spritzer" that tested at 0.76% Linalool with 0.81% Caryophyllene. It adds a very nice, unique taste. This blend also balances two terpenes with different reported effects (uplifting versus calming).

If you put these terpene profiles, or spectra, next to each other, it gives a nice visual comparison of the product's terpene content:

Our updated Cannabinoid Family Tree:

This is an updated cannabinoid bioavailability graphic that is included in our new pocket guide. If you take our survey, we'll send you two of them. Also, please let us know if something needs to be updated. New knowledge is discovered every day.

Happy Holidays and may your terpene spectrum perfectly match your goals!

9/21/2023:
Here is a quick analysis of a single strain from a single producer in Florida over about 18 months. Six different batches have 6 very different different terpene spectra.

9/15/2023:
Now why can't cannabis and hemp flower 'menus' include something like this? We're pretty sure most patients and consumers would appreciate it. It took all of 20 minutes to set it up in a spreadsheet. Could it be that retailers and growers don't want to start this conversation? We present the "TERPENE MENU":

9/1/2023:
This graphic presents an important point. The biggest difference between cannabis flower, hash, and rosin is the amount of "Other" molecules in the product besides cannabinoids, terpenes, and flavonoids. These "Other" molecules are not tested for in labs, and make up around 70% of the weight of flower. These molecules include esters, aldehydes, sterols, thiols, ketones, volatile sulfur compounds, and many others.
Hash products have usually reduced the "Other" molecules down to 40% or so, while rosin reduces them down to around 15%.

8/17/2023:
This is an updated Cannabinoid Family Tree graphic.

6/21/2023:
Here is our new top 23 terpene infographic that shows the terpene spectrum of assigned colors based on the generally accepted effects of each terpene. We thank The Emerald Cup for leading the way with this type of user-friendly classification.
We added 6 terpenes to their list of 17 because we were frequently seeing them in test results. The more 'uplifting' terpenes have assigned colors of red, orange, and yellow while the more 'calming' terpenes have assigned colors of green, blue, and purple.
Everyone has unique biochemistry, so these 'average' effects may not be the same for you. But we hope this will help you understand an important aspect of terpenes in cannabis and hemp.

5/14/2023:
In an effort to come up with a more helpful product label, this is what we've got right now. These were 2 flower cultivars we were looking at one evening recently:

2/21/2023:
Note that the terpene colors correspond to the 2022 Emerald Cup color standard where each terpene is assigned a specific color. Warm colors (red, orange, yellow) generally correlate with more energizing effects and cooler colors (green, blue, purple) correlate with more relaxing or calming effects.
Sample Cannabis & Hemp Product Label we WISH were on products:

1/23/2023:
Terpene Spectra can be used to compare cultivars in terms of the active ingredients found in most lab results. Below is a single cultivar from the same grower. Note that the second and third spectra are fairly consistent, but the fourth shows a significant loss of B-pinene and Phellandrene, and a gain of Myrcene. The fourth sample was purchased just 3 days after the third sample from the same vertically integrated medical cannabis retailer.

1/7/2023:
Here is a fictional terpene profile, or "Spectra" utilizing a stacked bar chart that has the four terpenes that contribute to the aroma and taste of chocolate:

1/7/2023:
This is our Terpene "Spectra" horizontal stacked bar chart. It's designed to give patients and consumers an idea of the terpenes in a product with just a quick glance. It is easy to compare with others, and gives a general idea of whether the product is more energizing (red, orange, and yellow) or more relaxing (blue and purple). This one shows extreme differences among two harvests of a single cultivar ("strain") of cannabis flower harvested just 6 months apart:

1/7/2023:
The following chart shows the terpene variation in the same cultivar, or strain of cannabis flower purchased from the same producer over a period of 15 months.

1/5/2023:
Cannabis Flower Components Pie Chart. "Other" is thiols, esters, aldehydes, sterols, volatile sulphur compounds, among others. This "silent majority" is not tested for, so we really don't know how much of each compound is in flower.

Before 1/05/2023:
This graphic is a "Family Tree" of the major cannabinoids, and the steps that The Amazing Flower (or nature or people) take to produce them:

Cannabinoids start out in an acidic form that is mostly water soluble. These acids (with a "-A" at the end) have been shown to have beneficial effects by themselves. One study showed that CBD-A was very effective at treating nausea, MUCH better than CBD. The plant makes these acidic cannabinoids in its trichomes, and then nature or humans turn them into the "neutral" cannabinoids like THC and CBD by adding heat, light, oxygen, & time.

The neutral cannabinoids are not water soluble, but are oil, or fat-soluble. The acidic cannabinoids are only partially water soluble. The human body likes water-soluble compounds, so getting the oil soluble compounds into the body can be challenging. Inhaling tends to be more efficient than ingesting neutral cannabinoids, however taking them with fatty foods can actually help improve their bioavailability a lot.

The next chart is a table of 4 lesser-known cannabinoids and their basic info and reported major effects: CBN, CBG, CBDV, and THCV. They do not have euphoric effects, but have shown beneficial effects in clinical research. We have this info for 18 major cannabinoids on our Cannabinoids quick reference page.

The graphic below gives a summary of the average bioavailability of cannabinoids based on the method of consumption. Note that there are significant differences.

The following chart depicts the dominant terpenes based on the classification of a cannabis flower as "Sativa" or "Indica". This was based on a 2011 study, and generally reflects the dominant terpenes of each "type". Here's more info on active ingredient consistency & reliability.

The following 2 graphs show the general groups of terpenes that tend to give more relaxing or more energizing effects. A more detailed Terpene Overview is on our Key Knowledge (The Basics) page.


The next chart is set up like a terpene "thermometer" for boiling points of 23 major terpenes in cannabis. We've got this and more info on 67 active ingredients in cannabis and hemp here: Cannabinoids, Terpenes, & Flavonoids. If you inhale (smoke or vaporize) products, this chart will show you which ones you are getting based on the temperature of your vaporizer. Smoking usually exceeds the combustion temperature, so believe it or not, you actually get MORE terpenes when you smoke since most vaporizers don't exceed 451F (233C). The references we used for boiling points are on the terpene page. You may notice these boiling points differ from some sources. That's why we put links to each boiling point reference on the terpene page. If you know of better references, please let us know. Thanks!

Smoking, or burning will usually reach temperatures high enough to include most of the active ingredients, but there are more losses & unwanted by-products than with a controlled vaporizer temperature.
Here's an alphabetical list of the top 23 terpenes color-coded by boiling point temperature:

The next chart shows just how many different possible combinations of active ingredients and amounts are possible. It's a LOT: over 290 billion.

The next two charts show the cost per milligram of active ingredients for flower and extracts or concentrates based on the cost per unit (Ounces for flower, and Grams for extracts). If you need higher doses like some patients, this is very important to understand, because costs vary WIDELY.
FLOWER:

